Graphy enables anyone to become a skilled data storyteller, by radically simplifying the way data is presented and communicated.Hey Product Hunt 👋
Since our launch last year on PH, Graphy has grown to nearly 100,000 users who have created hundreds of thousands of graphs.
We've had the opportunity to talk to and observe thousands of teams and companies as they navigate their data challenges.
One consistent pattern we noticed is that after spending hours analyzing data and building dashboards…
...most graphs you encounter:
😡 are overwhelming, 🤬 require unnecessary meetings to explain, 😤and lack actionable insights.
As a result, everyone leaves with different opinions and contradictory ideas about the next steps.
The issue is that the charts and dashboards you get from your BI tools, spreadsheets, or analytics platforms are designed for exploration by specialists — not for sharing!
That’s why we created Graphy for Data Storytelling — a new way to communicate data with clear graphs that deliver insights, empower decision-making, and drive action in your company.
Graphy makes it easy for anyone to become a skilled data storyteller by radically simplifying how data is presented and communicated.
This is our most exciting release yet, and here’s what we’re bringing to you:
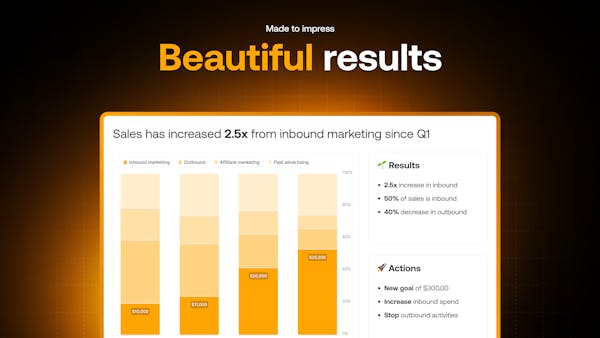
✨ Craft your story. Communicate insights and focus attention on key data points with visual annotations and one-click enhancements like goals and trend lines.
✨ Import data directly from Google Sheets, CSVs, or Excel. You asked for it (a lot), and we’re thrilled to finally offer this feature.
✨ Graphy got a glow-up. With a new UI and new chart types, our charts are now easier to create and more powerful.
We’d love your feedback!
P.S. To celebrate this launch, use the code PH40OFF to get 40% off our yearly plan!I’ve been using Graphy, it’s the fastest way to create graphs and they’re the most beautiful out there.@mehdidjabri thank you for all your support, Mehdi ❤️Thank you @mehdidjabri 🙏 really appreciate all the support@mehdidjabri the fastest! Yay! Thanks for the support!Graphy is an awesome product! Use it a ton! And this update is truly next level - congrats @andreyv !@jakob_knutzen1 💥🙏 thank you Jakob!Finally, someone thinks about the presentation of data visuals. How things look can highly affect how people absorb the information.
The AI generated insights are super cool!
Also love that you highlighted all the key use cases in your testimonials - very easy to spot why people love the product and what do they do the product for. I literally just talked about that in my newsletter analyzing homepages the other day!
Congrats on the launch @andreyv and team!@tonyhanded Tony, thank you so much for this great comment! I'm very glad to hear that you resonate with the problems we're trying to solve.
For now, we provide tools in Graphy to help you communicate the insights on your charts, but we're working on automating this with AI in our next release 🤫